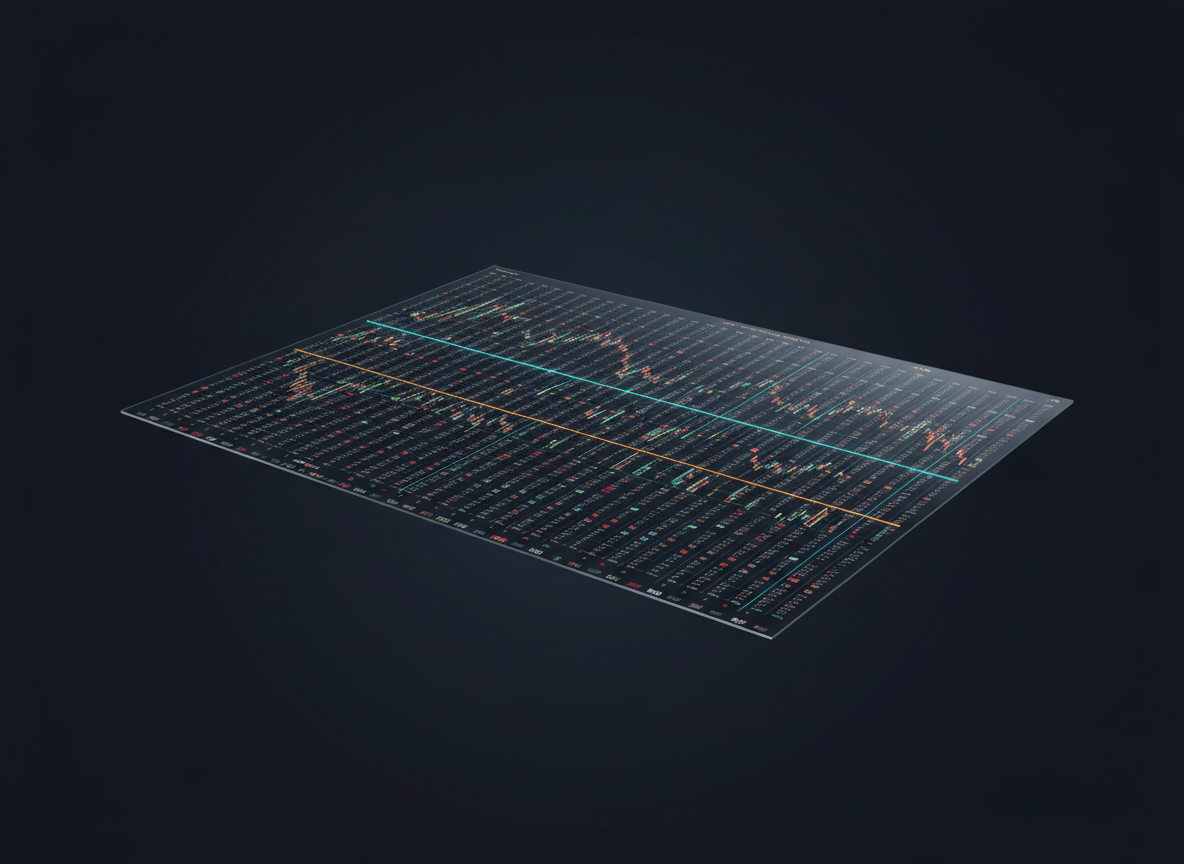
An elegant digital-art scene of a massive virtual spreadsheet suspended in mid-air, depicting a one-sheet overview of TSE Prime stock prices over a month. Each row becomes a thin luminous band with stylized OHLC ticks and micro candlestick charts, all color-coded in restrained blues, teals, and muted reds on a deep charcoal background. Surrounding the sheet, faint holographic frames evoke a Japanese-language interface without readable text, only icon-like shapes and blocks. Soft, cool white light from above highlights the structure while the background falls into a subtle gradient glow. Composed in a wide, cinematic aspect from a bird’s-eye perspective, the atmosphere feels precise, data-centric, and highly organized.

データ連携ガイド

東プラオールイン1シートの株価一覧を、自社ツールや社内システムから直接活用したい方向けの技術情報をまとめています。東証プライム市場の全銘柄について、1か月分の始値・高値・安値・終値データをAPIまたはCSVで取得し、既存の分析フローに組み込むまでの流れと注意点を解説します。シンプルな仕様で、最小限の実装コストでの連携を目指しています。

連携オプション

A sleek, abstract digital-art dashboard representing the Tokyo Stock Exchange Prime market, rendered as a single ultra-wide sheet floating in a dark navy, minimalist space. The sheet is filled with tiny, precisely aligned columns of colored OHLC bars and candlesticks, hinting at one month of price data for hundreds of stocks, yet all text is replaced by clean geometric blocks and subtle icons. Cool cyan and amber highlights trace key price ranges. Soft, controlled studio-style lighting creates gentle reflections on the sheet’s glossy surface, emphasizing its edges and grid structure. Viewed from a slightly elevated three-quarter angle with sharp focus throughout, the mood is professional, analytical, and calm, suitable for a technology-driven Japanese stock information site.

東プラオールイン1シートの株価一覧データは、REST APIとCSVエクスポートの2通りで取得可能です。銘柄コード単位や市場全体を指定した一括取得に対応しており、社内システムやダッシュボードへの自動連携にご利用いただけます。始値・高値・安値・終値を1か月分まとめて取得できるため、バックテストやレポート生成の基礎データとしても活用しやすい設計です。
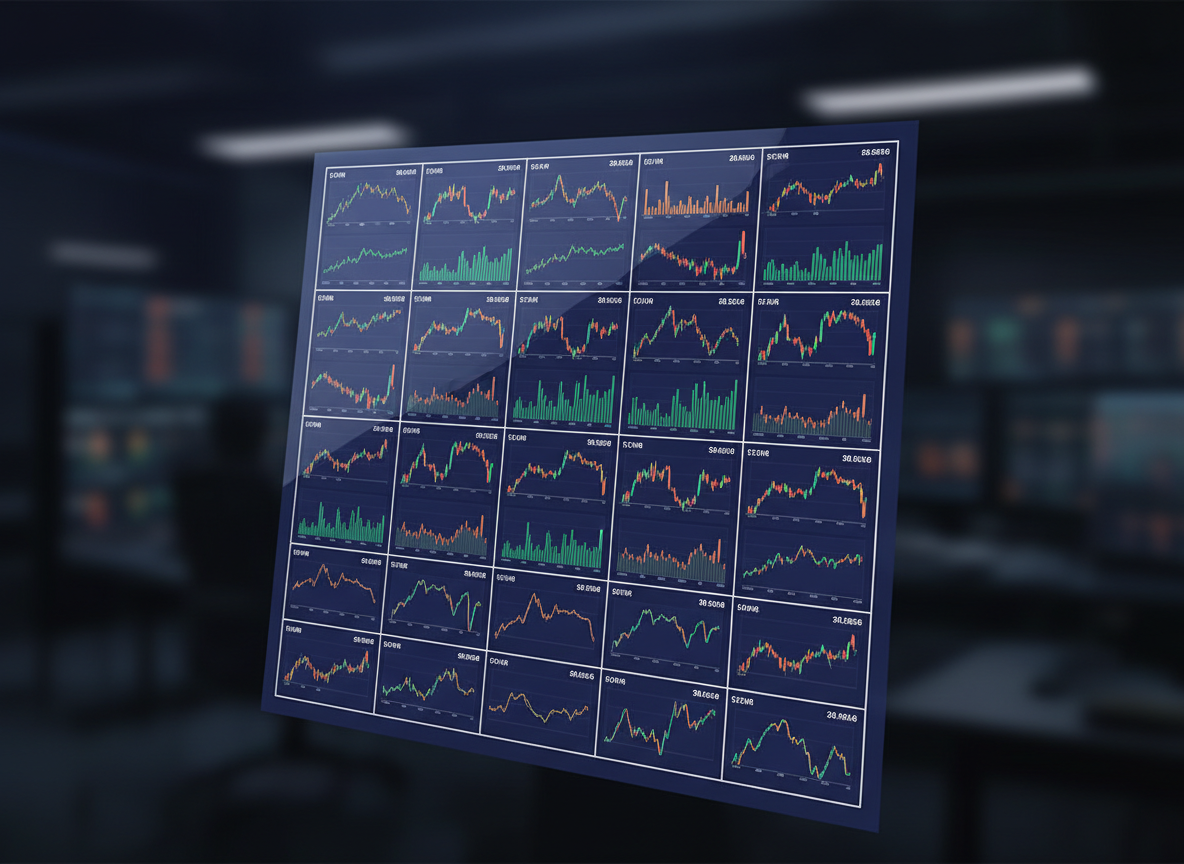
A close-up digital-art illustration of a sophisticated financial interface panel showing a compact portion of an all-in-one TSE Prime market sheet. Clean rows of rectangular cells contain abstract OHLC mini-bars and sparkline curves, arranged in perfectly aligned grids that suggest one month of trading data. Colors are restrained: deep indigo for the background, crisp white grid lines, with accent tones of emerald and amber indicating market movements. Soft, focused front lighting creates gentle reflections on the glassy panel surface, while the surrounding environment fades into a blurred dark tech workspace with subtle hints of other panels. Framed at a slight diagonal from an eye-level angle, the image conveys clarity, precision, and professional reliability.

APIではJSON形式で東証プライム市場の全銘柄OHLCを提供し、日次・月次の更新タイミングに合わせたバッチ連携を想定しています。CSVエクスポートは、人手による分析やExcel・BIツールへの取り込みを前提としたカラム構成で、証券コード・銘柄名・日付・始値・高値・安値・終値を標準出力します。利用用途やシステム構成に応じて、最適な取得方法をお選びください。

API個別相談

利用予定のシステム構成や必要な銘柄範囲、更新頻度など、個別の要件に応じたAPI利用・データ提供方法をご提案します。PoC向けの限定提供から本番運用レベルの連携まで幅広く対応可能です。フォームには、想定している利用目的と技術的な前提条件(使用言語やツールなど)をご記入ください。担当者より具体的な連携案とスケジュール目安をご連絡いたします。

← 戻る

ご回答をありがとうございました。 ✨

開発者向け更新情報