A sleek, abstract digital-art dashboard representing the Tokyo Stock Exchange Prime market, rendered as a single ultra-wide sheet floating in a dark navy, minimalist space. The sheet is filled with tiny, precisely aligned columns of colored OHLC bars and candlesticks, hinting at one month of price data for hundreds of stocks, yet all text is replaced by clean geometric blocks and subtle icons. Cool cyan and amber highlights trace key price ranges. Soft, controlled studio-style lighting creates gentle reflections on the sheet’s glossy surface, emphasizing its edges and grid structure. Viewed from a slightly elevated three-quarter angle with sharp focus throughout, the mood is professional, analytical, and calm, suitable for a technology-driven Japanese stock information site.

データ仕様

本ページでは、東証プライム市場全銘柄をどのような条件で取得し、一枚のシートに反映しているかを技術的な観点から整理しています。データソースや反映タイミング、欠損値発生時の扱い、各カラム(銘柄コード・銘柄名・始値・高値・安値・終値)の定義、並び順やフィルタリング仕様など、運用担当者・開発者向けの詳細仕様を明記しています。運用改善やシステム連携を検討される際の参照情報としてご利用ください。

サービス概要

東プラオールイン1シートは、東証プライム市場に上場する全銘柄を対象に、直近1か月分の始値・高値・安値・終値を一枚のシートで一覧表示するサービスです。個別銘柄ページを行き来することなく、全社の月次OHLCデータを同一画面で比較できます。デイトレーダーから機関投資家まで、スクリーニングや検証のたたき台として活用いただけます。具体的な画面構成や操作手順については、「使い方」ページで詳しく紹介しています。
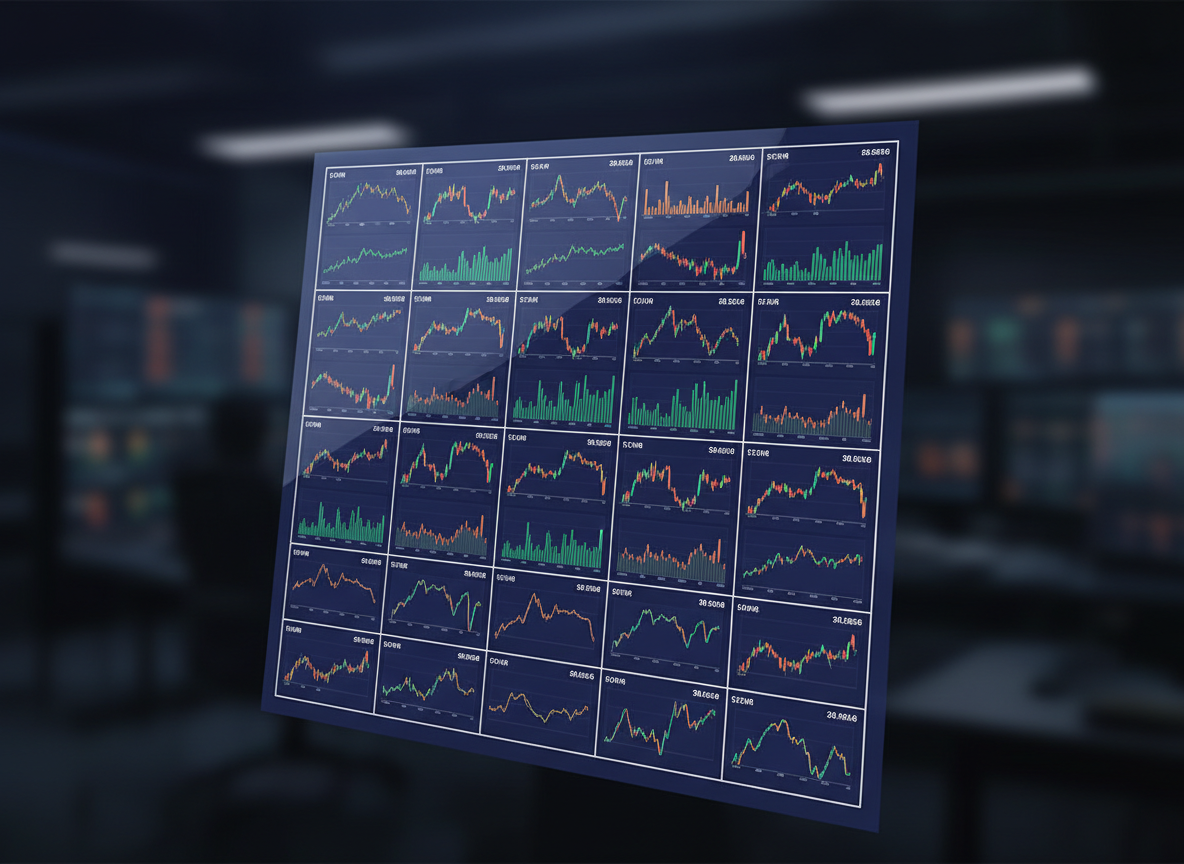
A close-up digital-art illustration of a sophisticated financial interface panel showing a compact portion of an all-in-one TSE Prime market sheet. Clean rows of rectangular cells contain abstract OHLC mini-bars and sparkline curves, arranged in perfectly aligned grids that suggest one month of trading data. Colors are restrained: deep indigo for the background, crisp white grid lines, with accent tones of emerald and amber indicating market movements. Soft, focused front lighting creates gentle reflections on the glassy panel surface, while the surrounding environment fades into a blurred dark tech workspace with subtle hints of other panels. Framed at a slight diagonal from an eye-level angle, the image conveys clarity, precision, and professional reliability.
A futuristic digital-art command center dominated by a single enormous horizontal data sheet displaying the entire TSE Prime market on one surface. The sheet stretches from left to right like an illuminated runway, filled with micro OHLC charts and monthly price ranges represented as colorful, yet subtle, bar clusters. The room itself is minimal, with dark metallic walls and a faint glow of blue interface lines that hint at a Japanese-style UI without showing real text. A cool, diffused overhead light bathes the sheet, creating crisp highlights on the data lines while the background remains subdued. Captured from a low, wide angle looking slightly upward, the mood is powerful, high-tech, and strongly analytical.

カラムと更新

本シートでは、銘柄コード・銘柄名に続き、日足ベースの始値(その月の初日の取引開始値)、高値(対象月中の最高約定値)、安値(対象月中の最安約定値)、終値(その月の最終売買日の終値)を表示します。データは月次確定後に一括更新され、更新完了日時をシート上部に明示します。取引停止や上場廃止などにより値が存在しない場合は「―」などの記号で欠損を表現し、補間は行いません。投資判断は必ず自己責任で行っていただくよう、注意書きも併記しています。

更新履歴

データ仕様の変更やカラム追加、算出ロジックの見直し、更新タイミングの調整など、運用に関わる主な変更点はすべて更新履歴として公開します。各リリースには反映日、変更内容、影響範囲(対象銘柄・カラム)、留意事項を明記し、過去分もアーカイブとして参照可能です。システム連携やバックテストに本サービスのデータを利用される方は、必ず本セクションを定期的に確認し、仕様差分を把握したうえでご利用ください。