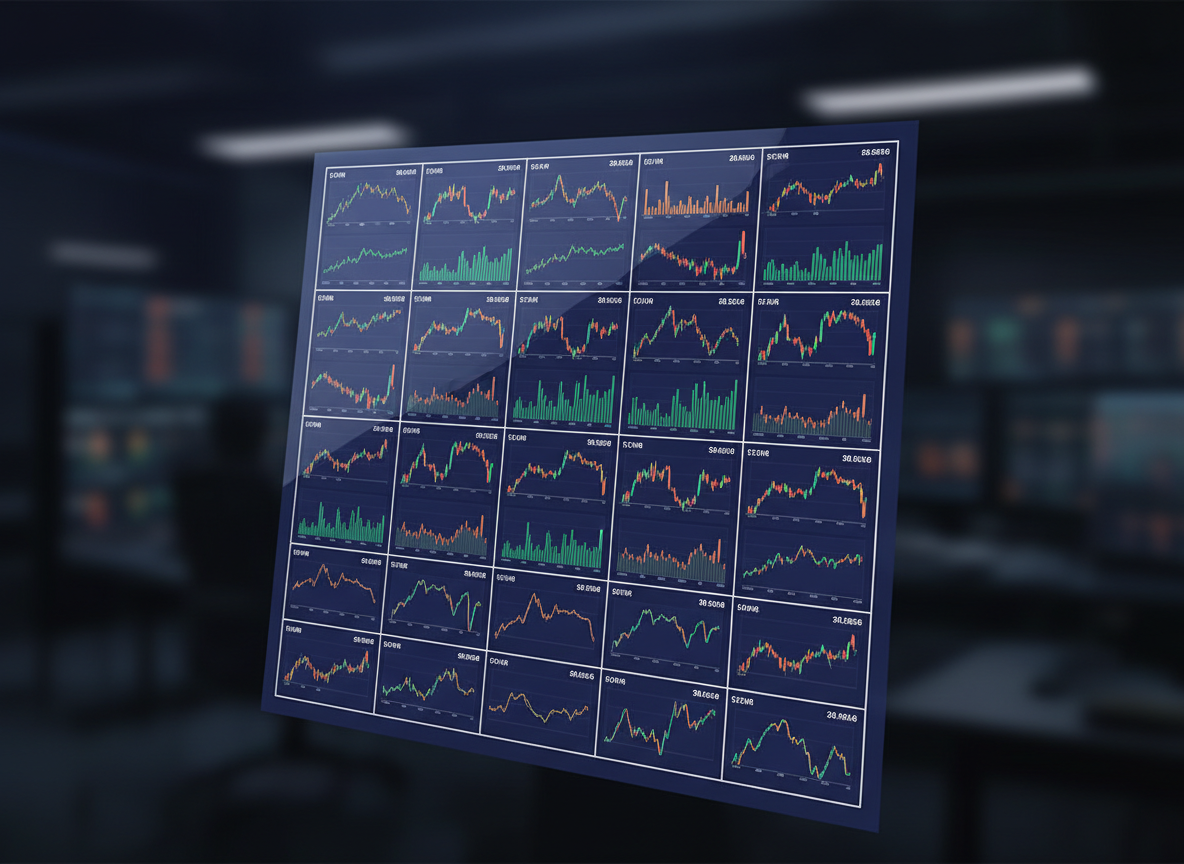
A close-up digital-art illustration of a sophisticated financial interface panel showing a compact portion of an all-in-one TSE Prime market sheet. Clean rows of rectangular cells contain abstract OHLC mini-bars and sparkline curves, arranged in perfectly aligned grids that suggest one month of trading data. Colors are restrained: deep indigo for the background, crisp white grid lines, with accent tones of emerald and amber indicating market movements. Soft, focused front lighting creates gentle reflections on the glassy panel surface, while the surrounding environment fades into a blurred dark tech workspace with subtle hints of other panels. Framed at a slight diagonal from an eye-level angle, the image conveys clarity, precision, and professional reliability.

基本画面ガイド

このページでは、東プラオールイン1シートの基本的な画面構成と主要機能を解説します。銘柄コード・銘柄名での検索、始値・高値・安値・終値など各列の並び替え、CSVエクスポートなど、日々のモニタリングに必須となる操作を、一つひとつスクリーンショット付きで確認できます。初めてご利用になる投資家・アナリストの方は、まず本ガイドに目を通していただくことで、一枚シートならではのスピーディな比較・分析ワークフローをすぐに構築できます。

紹介

画面構成と操作

東プラオールイン1シートは、東証プライム市場全銘柄の1か月分データを一枚の表で一覧できます。上部には月次期間と更新日の表示、中央に銘柄コード・銘柄名・始値・安値・高値・終値の主表、下部に凡例と注意事項を配置しています。列見出しをクリックすると昇順・降順で並べ替えができ、右上の検索ボックスでは銘柄コード・銘柄名の一部入力で瞬時に絞り込みが可能です。行をホバーすると該当銘柄の行が強調表示され、横スクロールなしで全列が視認できるよう、フォントとセル幅を最適化しています。これらの操作だけで、初めての方でも目的銘柄の月次OHLCを素早く確認できます。
A futuristic digital-art command center dominated by a single enormous horizontal data sheet displaying the entire TSE Prime market on one surface. The sheet stretches from left to right like an illuminated runway, filled with micro OHLC charts and monthly price ranges represented as colorful, yet subtle, bar clusters. The room itself is minimal, with dark metallic walls and a faint glow of blue interface lines that hint at a Japanese-style UI without showing real text. A cool, diffused overhead light bathes the sheet, creating crisp highlights on the data lines while the background remains subdued. Captured from a low, wide angle looking slightly upward, the mood is powerful, high-tech, and strongly analytical.
An elegant digital-art scene of a massive virtual spreadsheet suspended in mid-air, depicting a one-sheet overview of TSE Prime stock prices over a month. Each row becomes a thin luminous band with stylized OHLC ticks and micro candlestick charts, all color-coded in restrained blues, teals, and muted reds on a deep charcoal background. Surrounding the sheet, faint holographic frames evoke a Japanese-language interface without readable text, only icon-like shapes and blocks. Soft, cool white light from above highlights the structure while the background falls into a subtle gradient glow. Composed in a wide, cinematic aspect from a bird’s-eye perspective, the atmosphere feels precise, data-centric, and highly organized.

想定ユーザーと利用

東プラオールイン1シートは、東証プライム市場全銘柄を俯瞰したい個人投資家、複数銘柄を同時に追う機関投資家、銘柄スクリーニングやレポート作成を行うアナリストの利用を想定しています。月次の始値・安値・高値・終値を一画面で確認できるため、セクター別の騰落状況チェック、候補銘柄の一次スクリーニング、決算期前後の値動き検証など、「まず全体像を押さえたい」場面で力を発揮します。データ更新頻度や取得方法などの技術的仕様については、下記リンク先の「データ仕様」ページで詳しくご案内しています。

お問い合わせ

操作方法や画面表示、データの扱いに関するご質問・ご要望は、下記フォームよりお知らせください。銘柄検索・並び替えの挙動、エクスポート形式の追加希望、更新頻度に関するご意見など、今後の改善に直結するフィードバックを歓迎しています。内容を確認のうえ、運営チームよりメールにてご連絡差し上げます。投資判断に直結する情報を扱うサービスとして、皆さまからの声を反映しながら、より正確で使いやすい「一枚シート」を目指してまいります。